
Economic Impact of PA Rule
By Sandaruwan Madduma Bandara
The PA came to office on a wave of promises. None of them have been kept. Six years later the economy is in shambles. This is partially a result of the fact that neither the Finance Minister, nor the Deputy Minister of Finance of the PA, who served during that time, had any understanding whatsoever of economic or financial management. Further, many other cabinet ministers have been fighting among themselves, bringing further confusion and instability to the macroeconomy. The PA claimed that they had been given a bankrupt economy by the UNP regime. This is a blatant and obvious lie. The economy that the UNP handed over was booming. The PA has also claimed that the war effort has kept the Government from brining accelerated growth. However, the war situation is also in a sorry state. More men have been killed, more equipment lost and more territory and strategic positions conceded during the PA rule than at any time in the history of the conflict.
GNP
Growth
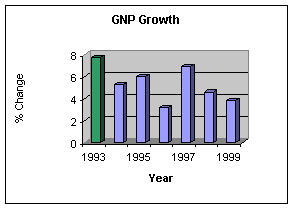
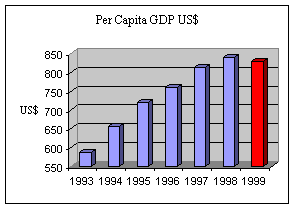
The GNP was growing at 7.7% in 1993 at the end of the Premadasa regime. Up to about 1995, the PA survived on the momentum of the UNP growth engine. GNP grew at 5.3% and 6% respectively in 1994 and 1995. However, after that it has been a story of steady decline. The years 1996, 1998 and 1999 are typical of the PA regime and show only an average GNP growth of just 3.9%. For the first time since 1977 the real per capita GDP of Sri Lanka declined in 1999. Per capita GDP was at US$ 839 in 1998. This came down to US$829 in 1999. Similarly per capita GNP declined from US$823 to US$807 in 1999 (CBAR, Key Economic Indicators).
Other
Countries
In 1999 newly industrialized Asian economies grew at 7.7%. Emerging economies of Asia grew at 6%. China showed a growth of 7.1% and India 6.8% (CBAR 1999, 13). Even in Asia, Sri Lanka continued to be left behind in economic growth and prosperity.
Sectoral
Growth
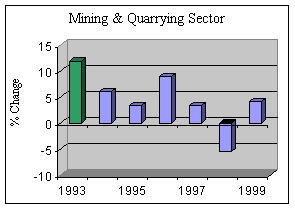
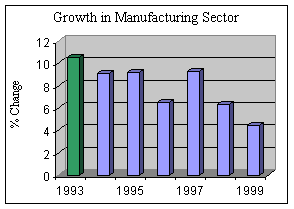
While the trend lines in other sectors such as agriculture, forestry, fishing, mining, construction and services are not so clear cut, there is no question that they are also on the decline. 1997 was an exceptional year because many of the high growth figures displayed are merely a recovery from the recession of 1996. Since 1997, growth in almost every sector in the economy has declined rapidly. The mining and quarrying sector was growing at 11.9% in 1993. It grew at just 4.1% in 1999. Manufacturing was growing at 10.5% in 1993. Growth had slowed in the sector to just 4.4% in 1999. Growth in construction slowed from 6.5% in 1993 to 4.8% in 1999.
Inflation
& Unemployment
The 1999 Central Bank Report claims that inflation has been contained at 4.7% and unemployment at 8.8% (CBAR 1999, p101, p112). However, information contained within the Central Bank reports themselves have clearly shown that the Central Bank can no longer be relied upon to release reliable information with regard to these two indicators. International prices of sugar and wheat declined 26% and 10% respectively (CBAR 1999, p10), contributing to lower inflation. Import volumes and prices also dropped in 1999. Therefore the Government can claim very little credit for maintaining a low rate of inflation.
The BOI managed to create just 33,000 new jobs in 1999. Further the Central Bank estimates that just 85,000 new jobs were created altogether in the economy in 1999. A massive exodus of 178,000 persons left the country for jobs abroad. The total number of Sri Lankans employed abroad is estimated at 788,000. 90% of these expatriate workers are employed in the Middle East (CBAR 1999, p6, p114). Unpaid family workers (i.e. housewives) are considered “employed” according to the new Central Bank definition. This approach tends to overstate employment figures significantly. The Central Bank admits that the true unemployment rate in Sri Lanka is 10.2% (CBAR 1999, p112). Women tend to constitute a majority of the unemployed, perhaps due to social factors. 47.8% of the unemployed are youth between the ages of 15 and 29. 30.3% of the unemployed are educated (i.e. O/L, A/L or higher education), (p113, Table 7.6).
Wages
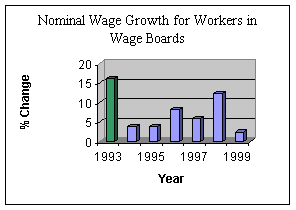
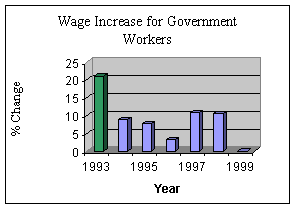
While prices and taxes have risen steadily during the PA regime, wages have stagnated. Wages for workers in wage boards increased by 16.2% in 1993. Wages only increased by 2.5% in 1999. Wages for Government workers increased by 21.1% in 1993. They did not increase at all in 1999. The Central Bank report proudly proclaims that current expenditure was maintained at 1998 levels at the expense of Government worker salaries (CBAR 1999, p10, p11). Overall it is fair to say that while the cost of living burden has increased dramatically, real wages have steadily declined.
Trade
(Exports)
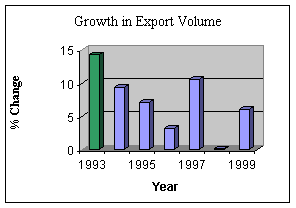
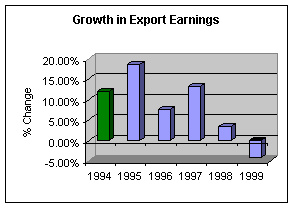
The Export sector also suffered heavily at the hands of the PA Government. Apart from massive corruption of Ministers and Government officials involved in bribery and commission taking, the Government deliberately engaged in policies that dampened the sector. Export volume was growing at 14.3% in 1993. It grew just 6.1% in 1999. During the first eight months of 1999 exports declined by as much as 11%. Export prices also declined by 10%, partly due to international conditions. The combined effect of this was a drastically reduced income from exports. Export earnings declined by 4% in 1999. The trade deficit widened by 19% to US$ 1.299 billion in 1999 (CBAR 1999, p2, p17).
Budget
Deficit
The budget deficit situation has also not improved in spite of much fanfare by the PA that it has brought better financial management. The budget deficit stood at 6.8% of GDP in 1993 after grants and privatization. This figure has worsened to 7.5% in 1999. During much of the PA regime the Budget Deficit has remained over the 8% mark.
In external finance the services and income accounts have also declined dramatically. The balance in these accounts has gone from US$39 million in 1993 to US$-107 million in 1999. Deficit in the Income account increased from US$ 180 million to US$254 million due to lower income from investments and a higher interest payments on foreign debt. The current account deficit increased from US$ 226 million in 1998 to US$ 495 million in 1999. There was a declined in long term capital flows to the Government. Overall Balance in external finance has suffered severely and has gone from US$661 million in 1993 to US$-263 in 1999. In 1999 the current account deficit increased to 3% up from 1.4% of GDP in 1998. A terms of trade loss of 7% was registered in 1999. Debt as a percentage of GDP increased from 56% to 57% in 1999 (CBAR 1999, p2, p16, p17).
Credit to the Government from the banking system increased significantly in 1999. The PA which was desperately short of funds needed the sale of Telecom shares to maintain financial solvency (CBAR 1999, p3). Since the deal did not come through in 1999, the Government was in dire straits. The PA’s simplistic strategy for revenue generation seems to be to chop up the living room furniture to keep the fire going.
Taxes
Although various claims have been made about reduction and simplification of import tariffs, this is yet to be seen at the practical level. The overall tax to import a diesel vehicle remained at 173% of invoice value in 1999 (CBAR, p11).
Government tax revenue increased 13% in 1999, particularly due to increased NSL. NSL revenue to the Government increased by 33% in 1999. This marked a significant increase of the tax burden placed on the people. Income tax revenue also rose 38% in 1999. Excise tax revenue increased 19% in 1999 (CBAR, p121, p122).
Exchange
Rates and Stock Market
The rupee depreciated 8.2% against the US dollar in 1999. Rupee depreciation in 1998 was only 6% (CBAR, 1999, p4).
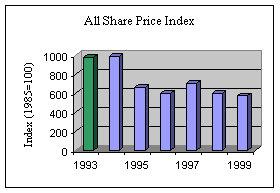
The performance of the share market is no secret to anyone. A dramatic decline occurred in share prices with the Government assisted assassination of Mr. Gamini Dissanayake in 1994. The share markets have never recovered from this slump. In 1993 the All Share Price Index stood at 979. This has plummeted to 573 in 1999. The Sensitive Price Index stood at1442. This index now wallows at just 938. This is in spite of the Index being redefined as the Milanka Price Index with the base year 1998 taken as 1,000.
Agriculture
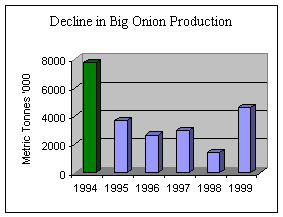
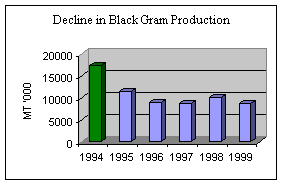
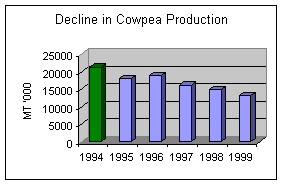
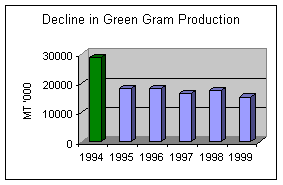
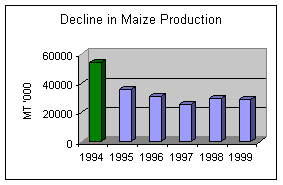
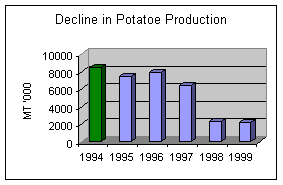
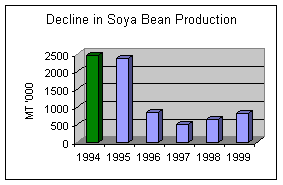
In the agricultural sector the Government followed its usual asinine policy of vacillation. The import duty on rice, which is necessary to maintain domestic production, was partially waived during the latter part of 1999 (CBAR 1999, p6). The PA’s lack of commitment to the domestic farmer in many sub-sectors like rice, potato, onion and chillie, is the principal reason for massive deterioration of production and productivity. The farmer requires a stable price environment in order to make intelligent and long term economic decisions. So long as the Government continues to destabilise the sector to serve short term political agendas, the farmers of Sri Lanka will always remain an underprivileged group. The only significant contributory factor to higher production of rice in 1999 was rain. Production of none of the major field crops have recovered to the levels seen during UNP Government
The average price of tea at the Colombo auction declined by 14% in 1999. Export earnings from tea declined 13% in 1999. Export earnings from tea declined by 15% (CBAR 1999, p7, p34).
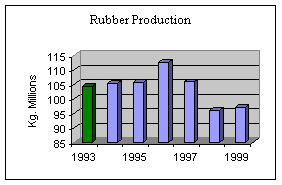
In the rubber sector replanting has declined by 58%. The use of fertilizer has also declined. Prices of RSS 1 and latex crepe IX dropped by 10% and 18% respectively (CBAR 1999, p7, p36). The sector can be expected to contract significantly in coming years as a result of this.
The coconut sector performed better as a result of the lagged effects of good weather from 1998.
Transport
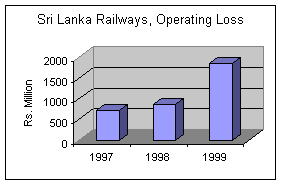
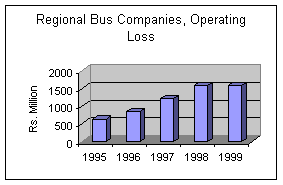
In the transport sector Sri Lanka Railways continued to be a massive drain on Government coffers. The operating loss of SLR increased from Rs. 1.066 billion in 1998 to Rs. 1.848 billion in 1999. Railway fares have not been revised since 1996 (CBAR 1999, p8). Even though Minister G.L. Pieris announced that fare revisions had originally been planned, these were later dropped in a bid to gain popularity for the Presidential elections in 1999.
102,853 new motor vehicles were registered in 1999. New private cars constituted 10,532 of this, up from 6,142 in 1998. Poor import control of motor vehicles in this manner has resulted in an ever increasing level of traffic congestion particularly in urban area. Road development has not kept up with the increasing number of vehicles. Further traffic management is shamefully poor.
Economic
Targets and Impact of War
The Government also published a nonsensical policy statement called Vision 21 which fantasized about an economic growth rate of 7-8%. It is clear that the PA was expecting UNP economic management to return if this target was to be met. It is estimated that the war in the North and East is costing the nation 2-3% in investment and consequently 2-3% in economic growth. Part of the Government’s policy was to address structural weaknesses in the economy. This included privatization of gas, plantations, telecommunications, national airlines and simplification and reduction of taxes (CBAR 1999, 22).
Illegal
Privatisation & Monopolies
The
corrupt sale of such companies as gas and telecommunications and the grant
of monopoly power to the private owners has resulted in skyrocketing costs
in both these areas. The illegal sale of the national airlines has
resulted in its cannibalisation by the airline that purchased it. As for
taxes, the imposition of GST and a consistently increasing National
Security Levy has resulted in a massive tax burden on the people.